Higher And Higher CPC’s, or How Google Might Be Making You Pay More For Less
Do you trust Google to set your CPC’s for you?
If you’re bidding for conversions, you probably are. (Unless you’re using a bid cap which I’ll talk about below).
Here’s what we’ll go over:
- How to spot if Google is increasing your CPC’s past what is incremental
- How to reduce your CPC’s on automated bidding strategies to keep similar volume at improved efficiency
As with all research articles published, this code is free to use and modify.

The problem is very simple
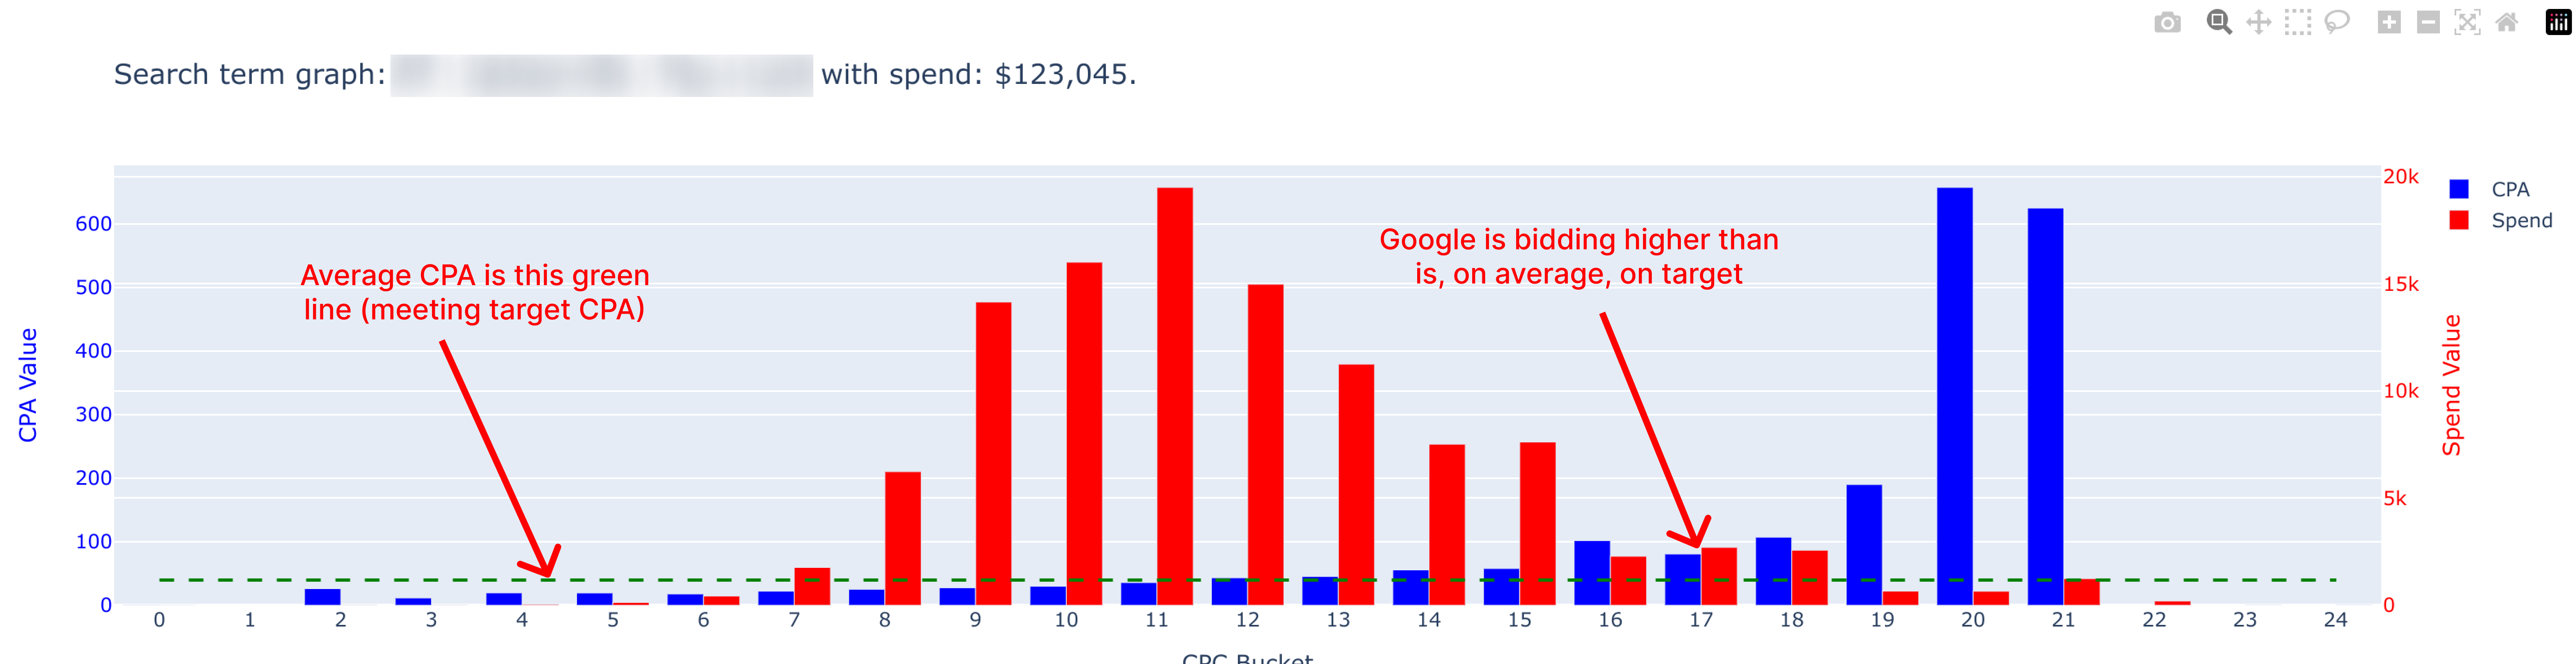
The below campaign is on target and has spent $123,045 recently.
As you can see, as CPC’s increase above $13, the likelihood of hitting a CPA that is on target decreases.
So why does this happen?
Google balances these three factors per campaign:
- Deliver on target CPA
- Deliver maximum volume
- Deliver maximum revenue to Google
The reason Google is getting away with spending much higher per CPA is because, on average the campaign is still reaching target CPA.
This is not good for the advertiser who knows they can fight back.
If you have been skimming thus far, here’s where you should tune back in 👇
Google is selling us on their ability to bid much higher for users who will be much more likely to convert.
Their claim is if they don’t bid so high, we won’t get the conversion.
This is false. We can:
- Reduce the max we’re willing to pay for these “high value” users
- Capture a similar volume of them at a lower cost
- Increase volume (or at least keep it the same) while decreasing our CPA
How to test this yourself
Create a campaign experiment and set a CPC target (covered below) that excludes the top 10% of CPC’s, determined by spend.
For example, if 10% of your spend is above $18 per click, set a CPC cap of $18.
In my testing this can amount to a 10% increase in efficiency at similar volumes. If impression share is under 50% the volume may even increase at the lower cost.
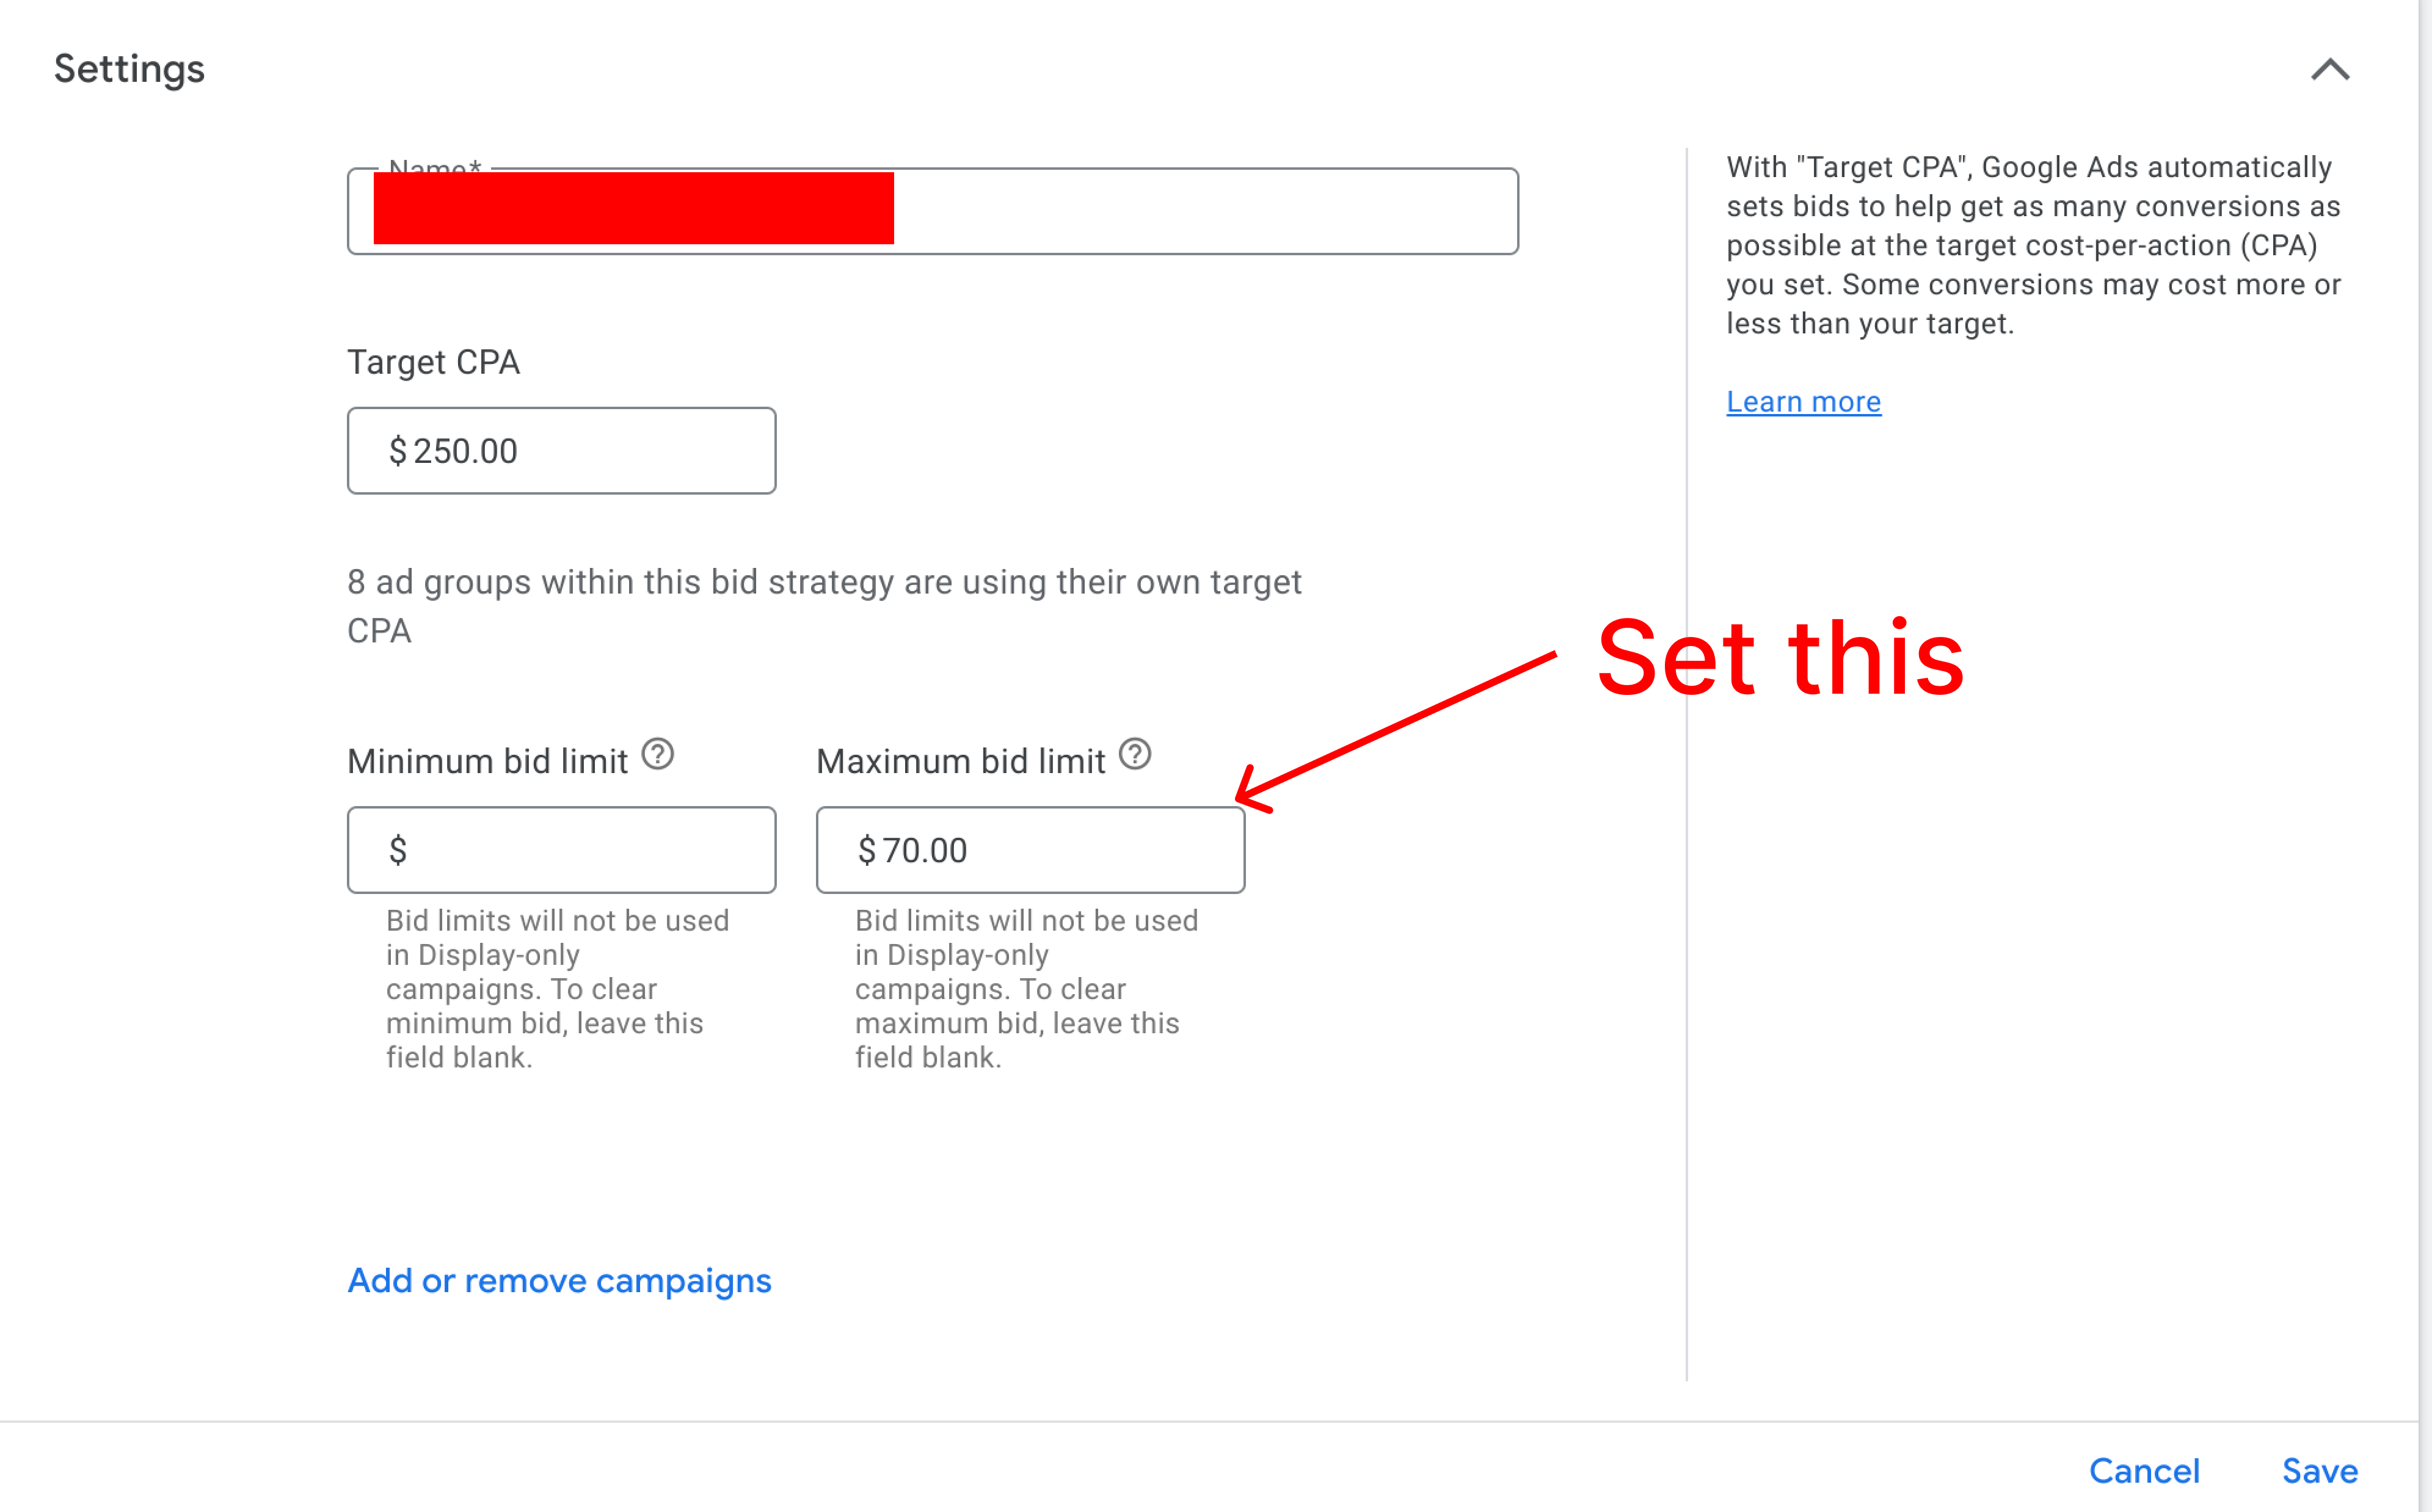
How to set bid caps
To set a CPC cap, you can use a Portfolio bid strategy.
How does this analysis work? Why is it accurate?
The special part of this analysis is how we determine CPC’s.
Typically, Google gives us an average CPC. Using an average CPC will hide outliers of very high CPC’s that we want to find and exclude.
To get around this, we use a GAQL query to segment as far as we can, giving us a true cost per “click” rather than average CPC.
For maximum accuracy, I pull two different segmented click reports.
- Keywords, because the keyword view will include the total cost data
- Search terms, because each search term can be associated to multiple keywords, we’re able to get a more accurate cost per click, rather than an average CPC
This reference a function called arbitrary_google_ads_query which you can find in my Github: https://github.com/austincollinpena/google-ads-open-research
You can drop the below code in a Jupyter notebook to get started.
    import pandas as pd

    from arbitrary_query import arbitrary_google_ads_query
    from local_secrets import get_secret
    from create_cpc_buckets_for_diminishing_returns import create_cpc_buckets_for_diminishing_returns
    import plotly.graph_objects as go


    keyword_df = arbitrary_google_ads_query('account-id', mcc_id='mcc-id',
                                            refresh_token=get_secret("austin_refresh_token"),
                                            select=["ad_group_criterion.keyword.text", "ad_group.campaign", "ad_group.id",
                                            "ad_group.type", "campaign.id", "campaign.name", "segments.date",
                                            "segments.device", "segments.click_type", "segments.ad_network_type",
                                            "segments.slot", "metrics.average_cpc", "metrics.average_cost",
                                            "metrics.clicks", "metrics.conversions", "metrics.conversions_value",
                                            "metrics.cost_micros", "metrics.impressions"],
                                            from_arg="keyword_view",
                                            parquet_cache=True,
                                            where_argument="segments.date BETWEEN '20240501' AND '20240601' AND metrics.clicks > 0",
                                            order_by=None)

    searchterm_df = arbitrary_google_ads_query('account-id', mcc_id='mcc-id',
                                                refresh_token=get_secret("austin_refresh_token"),
                                                select=["metrics.all_conversions", "metrics.clicks",
                                                "metrics.conversions",
                                                "metrics.cost_micros", "metrics.impressions",
                                                "ad_group_ad.ad.id",
                                                "segments.date", "segments.keyword.info.text",
                                                "ad_group.campaign",
                                                "campaign.id", "campaign.name", "segments.ad_network_type", "ad_group_ad.ad.name",
                                                "ad_group_ad.ad.type", "segments.search_term_match_type"],
                                                from_arg="search_term_view",
                                                parquet_cache=True,
                                                where_argument="segments.date BETWEEN '20240501' AND '20240601' AND metrics.clicks > 0",
                                                order_by=None)

    def create_cpc_buckets_for_diminishing_returns(df: pd.DataFrame, bucket_range: float=1):
        # bucket_range are the steps to place cpc values into. For example a bucket of 1 will group by cpc values of 1-2, 2-3, 3-4, etc.
        expected_columns = ['metrics.clicks', 'metrics.impressions', 'metrics.cost_micros', 'campaign.name']
        if not all([col in df.columns for col in expected_columns]):
        raise ValueError(f"Expected columns {expected_columns} not found in DataFrame")
        df['cost'] = df['metrics.cost_micros'] / 1000000
        df['cpc'] = df['cost'] / df['metrics.clicks']
        df = push_metric_into_buckets(df, 'cpc', bucket_range)
        grouped = df.groupby(['campaign.name', 'cpc_bucket']).sum()[['cost', 'metrics.clicks', 'metrics.impressions', 'metrics.conversions']].reset_index()
        grouped['cpa'] = grouped['cost'] / grouped['metrics.conversions']
        return grouped

    def push_metric_into_buckets(df: pd.DataFrame, metric_name: str, bucket_range: float) -> pd.DataFrame:
        df[f'{metric_name}_bucket'] = (df[metric_name] / bucket_range).apply(lambda x: bucket_range * int(x))
        return df

    grouped_by_search_terms = create_cpc_buckets_for_diminishing_returns(searchterm_df)
    grouped_by_keyword = create_cpc_buckets_for_diminishing_returns(keyword_df)

    campaigns_ordered_by_spend = keyword_df.groupby('campaign.name')[['metrics.cost_micros', 'metrics.conversions']].sum().sort_values(by="metrics.cost_micros", ascending=False).reset_index()[['campaign.name', 'metrics.cost_micros', 'metrics.conversions']]
    campaigns_ordered_by_spend['cost'] = campaigns_ordered_by_spend['metrics.cost_micros'] / 1000000
    campaigns_ordered_by_spend['cpa'] = campaigns_ordered_by_spend['cost'] / campaigns_ordered_by_spend['metrics.conversions']
    campaigns_ordered_by_spend.head()

    def graph_values(df: pd.DataFrame, title: str, avg_cpa: float):
        cpc_bucket = df['cpc_bucket']
        cpa = df['cpa']
        cost = df['cost']

        # Creating the bar for CPA with primary y-axis
        cpa_bar = go.Bar(
        x=cpc_bucket,
        y=cpa,
        name='CPA',
        marker=dict(color='blue'),
        yaxis='y1',
        offsetgroup=1
        )

        # Creating the bar for Cost with secondary y-axis
        cost_bar = go.Bar(
        x=cpc_bucket,
        y=cost,
        name='Spend',
        marker=dict(color='red'),
        yaxis='y2',
        offsetgroup=2
        )

        layout = go.Layout(
        title=title,
        xaxis=dict(
        title='CPC Bucket',
        tickmode='linear',  # Ensures every bucket has a tick
        tick0=0,
        dtick=1  # Adjust this value based on your specific x-axis increments
        ),
        yaxis=dict(
        title='CPA Value',
        titlefont=dict(color='blue'),
        tickfont=dict(color='blue')
        ),
        yaxis2=dict(
        title='Spend Value',
        titlefont=dict(color='red'),
        tickfont=dict(color='red'),
        overlaying='y',
        side='right'
        ),
        shapes=[
        dict(
        type='line',
        x0=0,
        y0=avg_cpa,
        x1=max(cpc_bucket),
        y1=avg_cpa,
        line=dict(color='green', width=2, dash='dash'),
        yref='y1'
        )
        ],
        barmode='group'  # Ensures bars are side by side
        )

        fig = go.Figure(data=[cpa_bar, cost_bar], layout=layout)
        fig.show()

    top_five_campaigns = campaigns_ordered_by_spend.head(5).to_dict(orient='records')
    for c in top_five_campaigns:
        campaign_name = c['campaign.name']
        campaign_spend = c['cost']
        avg_cpa = c['cpa']
        campaign_df_keyword = grouped_by_keyword[grouped_by_keyword['campaign.name'] == campaign_name]
        campaign_df_search_term = grouped_by_search_terms[grouped_by_search_terms['campaign.name'] == campaign_name]
        graph_values(campaign_df_search_term, f"Search term graph: {campaign_name} with spend: ${round(campaign_spend):,}.", avg_cpa)
        graph_values(campaign_df_keyword, f"Keyword graph: {campaign_name} with spend: ${round(campaign_spend):,}", avg_cpa)